UAE Infrastructure & Mobility
Dubai's Bus On Demand Ridership Is Up 25%: What Private Transport Operators Can Learn From It
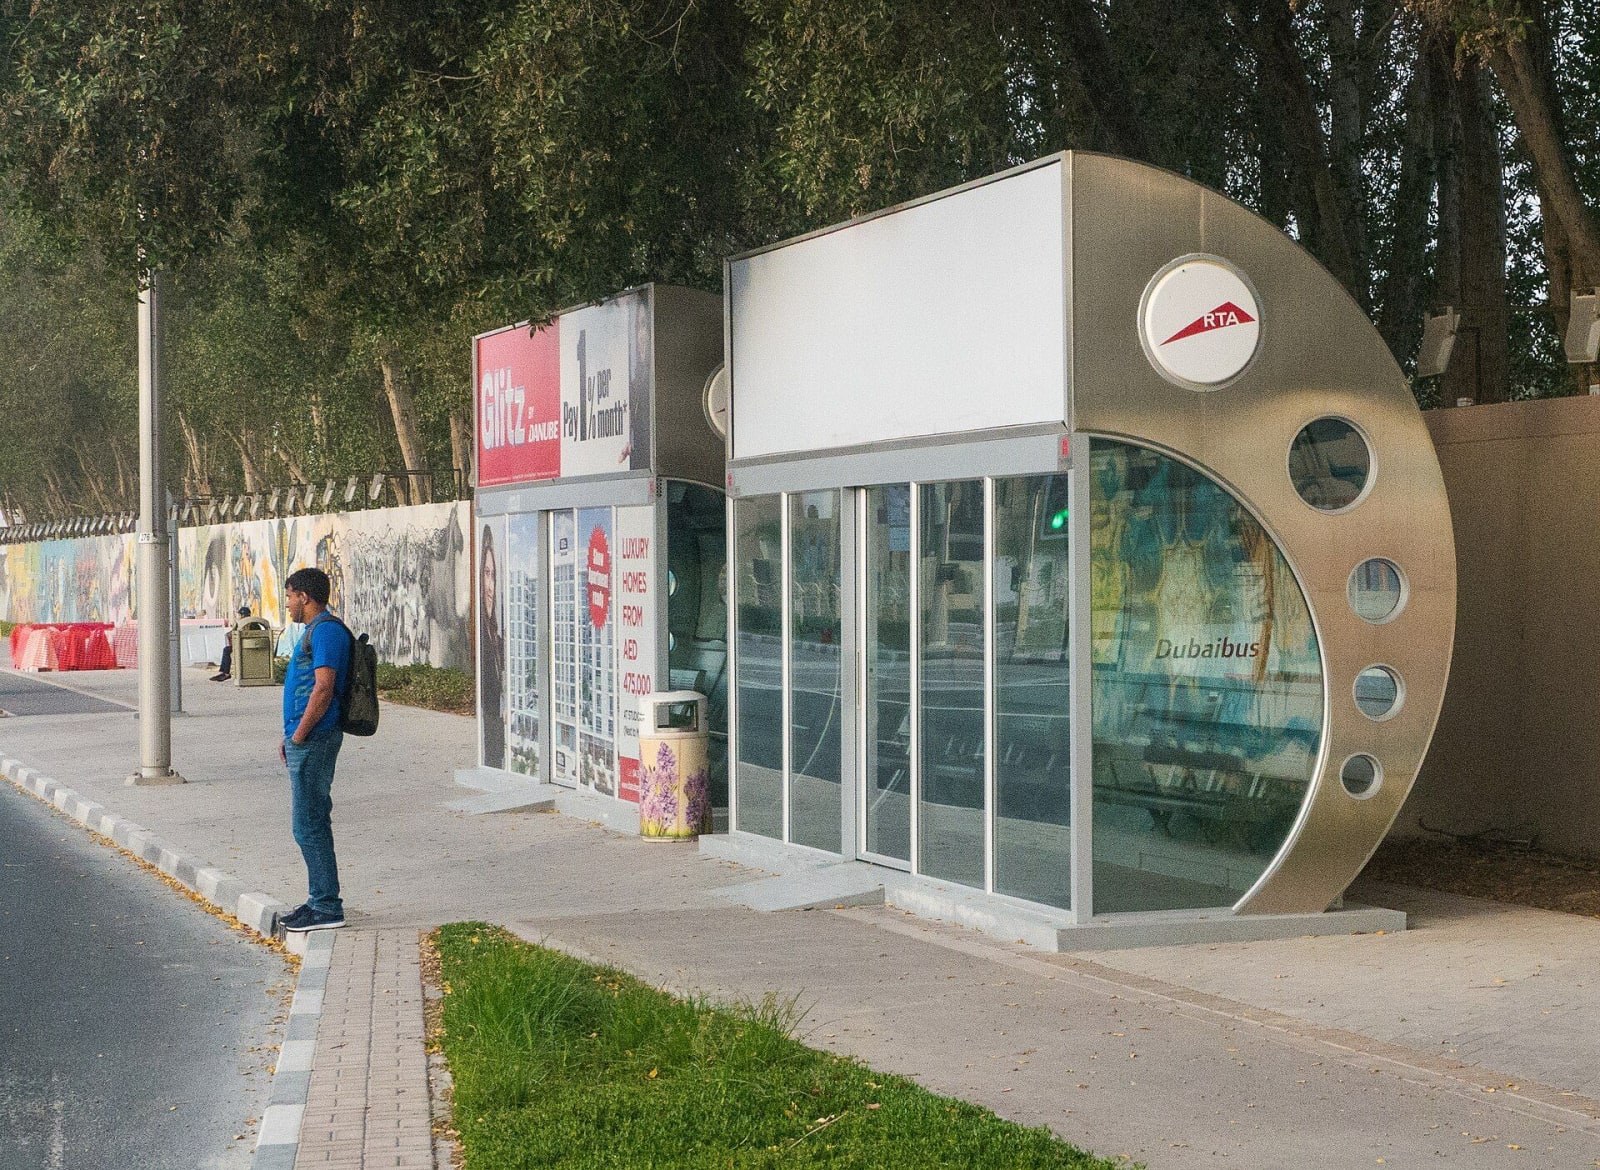
RTA's Bus On Demand service carried 527,000 riders in the first half of 2026, up 25.1% on the same period the year before. That single statistic tells you something worth paying attention to if you run a private passenger transport business anywhere in Dubai. A public transport service built specifically around flexible, clustered pickups rather than fixed routes just proved, with real numbers, that this model works and that demand for it keeps growing. The question worth asking is not whether this competes with private operators. It is what the data behind it reveals about a kind of demand you might already be serving badly without realizing it.
What actually happened, in real numbers
RTA confirmed the ridership figures in early August 2026. Alongside the 527,000 riders for the first half of the year, June 2026 stood out as the single busiest month on record for the service, with 105,990 passengers using it in that month alone. To keep up with that growth, RTA expanded its Bus On Demand fleet to 55 vehicles and grew coverage from 17 areas to 20, adding Al Satwa, Al Quoz, and Mirdif in its most recent expansion, a 54% increase in the areas the service reaches.
The full list of areas now covered includes Al Barsha, Al Nahda, Dubai Silicon Oasis, Academic City, Al Rigga, Port Saeed, Business Bay, Downtown, Oud Metha, Al Karama, Barsha Heights, Al Mankhool, DIFC, Al Warqaa, Dubai Investment Park, Jumeirah Village Circle, Al Qusais, Al Satwa, Al Quoz, and Mirdif. That is a genuinely broad spread across the city, touching everything from dense residential districts to business and logistics hubs. Passengers book through a dedicated app, register once, and pay by card or the nol payment system rather than dealing with cash or a fixed schedule.
For context on just how much of Dubai's transport habits are shifting toward this kind of flexible, app based model, combined shared mobility across the city, on demand buses, app based vehicles, and hourly rentals together, carried 25.7 million riders in the first half of 2026 alone.
The operating idea behind the numbers
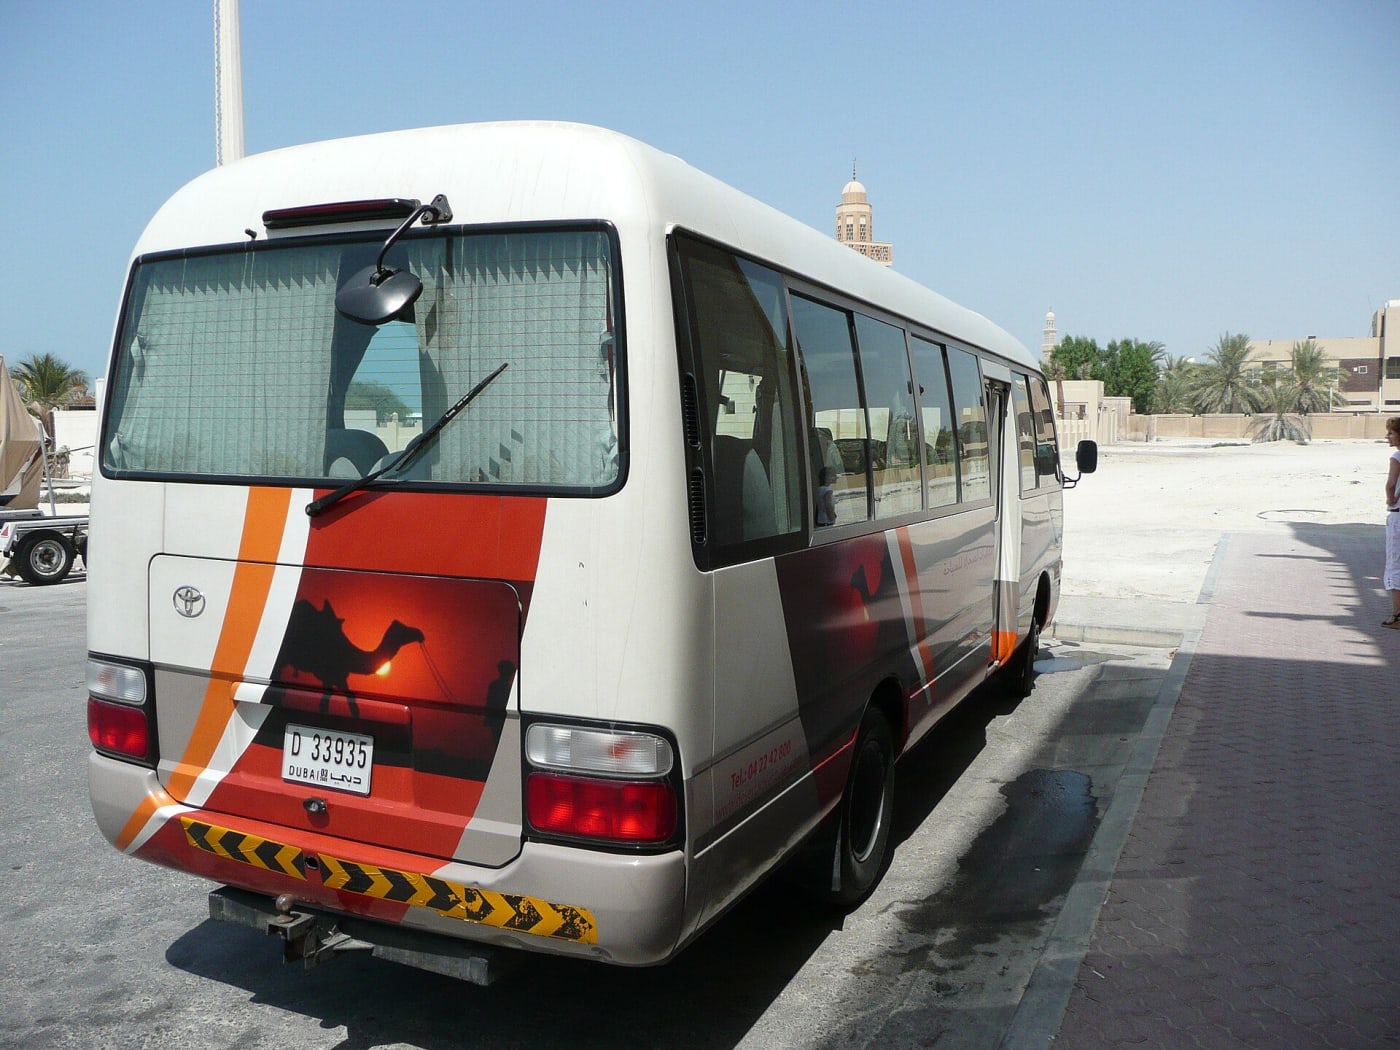
Bus On Demand does not run on a timetable the way a conventional public bus route does. Instead, it clusters passengers heading in a similar direction around the same time and dispatches a vehicle sized to that specific demand, adjusting pickup points based on who has actually booked rather than serving a fixed set of stops regardless of whether anyone is waiting there. The service scales the number of vehicles running in a given area up or down based on real time booking patterns rather than a schedule fixed months in advance.
This is a meaningfully different design philosophy from either a traditional fixed route bus or a one to one taxi trip. It sits deliberately in between, capturing some of the cost efficiency of shared transport while keeping much of the convenience of a more personalized pickup. RTA did not build this because it was theoretically interesting. They built it because a genuine gap existed between fixed route public transport, which serves high volume corridors well but forces everyone else into long walks or transfers, and individual point to point transport, which is convenient but expensive to scale across an entire city.
Why this matters even if you never compete with RTA directly
It would be easy to read all of this as public sector news that has nothing to do with a private operator running staff transport, school routes, or corporate shuttle contracts. That would be a mistake, because the underlying lesson has nothing to do with who operates the vehicles. It is about how demand actually behaves once you can see it clearly, rather than guessing at it.
Most private transport operators build their routes around whatever pickup pattern was agreed with a client at the start of a contract, and that pattern often stays fixed for years regardless of whether it still matches where people actually live, work, or want to be picked up. Nobody goes back and asks whether twelve scattered individual pickups could be consolidated into three clustered stops without meaningfully inconveniencing anyone, because nobody is looking at the data closely enough to notice the opportunity. RTA's own data, growing by 25% in a single year, suggests that when you do look closely at where demand actually clusters, real efficiency gains are sitting there waiting to be found.
What operators can genuinely learn from this
The most direct lesson is about passenger clustering. If your business runs multiple individual pickups scattered across a district that could reasonably be served by two or three consolidated stops within a short walk of most passengers, you are very likely running more vehicle time and fuel cost than the actual demand requires. This is worth reviewing periodically rather than assuming the original route design from years ago is still the most efficient version available.
The second lesson is about matching vehicle size to actual demand rather than defaulting to whatever vehicle happens to be available. RTA scales its fleet dynamically because a service running fixed large vehicles regardless of actual booking volume wastes capacity on quiet periods and runs short during peak ones. A private operator serving a corporate contract with genuinely variable daily headcount, common with staff transport where attendance fluctuates, can apply the same logic by matching a smaller vehicle to a lighter day rather than running the same large bus regardless of who actually shows up.
The third lesson, and probably the most valuable one, is about visibility into recurring demand that currently hides in informal channels. A city wide pattern like Bus On Demand's growth only becomes visible because every booking flows through one system that RTA can actually analyze. Most private operators do not have that visibility into their own business. Recurring pickup requests, informal route change requests, and genuine demand patterns often live scattered across driver WhatsApp messages, individual salespeople's memory, and disconnected records that nobody ever aggregates into a single picture. The demand is there. It is simply invisible until someone builds a system capable of seeing all of it in one place.
Forecasting instead of reacting
There is also a planning discipline worth borrowing here. RTA did not wait for buses to be overcrowded before adding capacity. The fleet expansion to 55 vehicles and the addition of three new coverage areas followed observed booking growth, treated as a forecasting signal rather than a complaint to react to after the fact.
A private operator with genuine visibility into booking and pickup patterns across every contract can apply the same logic. If a particular corporate client's headcount at a specific pickup point has grown steadily over several months, that is a forecasting signal worth acting on before the vehicle is consistently overcrowded, not a problem to solve only once a client complains. Waiting for a complaint means you have already delivered a worse service for weeks or months before addressing it.
A worked example of what clustering actually saves
It helps to make the clustering argument concrete rather than abstract. Picture a staff transport contract currently running eight separate pickups scattered across a residential district, each stop only a few minutes apart from the next by road, serving a total of thirty employees heading to the same workplace each morning. If four of those eight pickups sit within a comfortable five minute walk of each other, consolidating them into two clustered stops instead of four scattered ones removes several minutes of stop and start driving time from every single morning run, without meaningfully increasing the walk for any of the thirty passengers involved.
Multiply that saved time across every working day in a month, and the reduction in driver hours and fuel use becomes a real number rather than a marginal one. None of this requires new technology to identify. It requires actually mapping where every passenger on a route is picked up, at least once, and asking honestly whether the current stop pattern reflects genuine geographic necessity or simply how the route happened to be set up when the contract first started.
What this means for pricing conversations
There is also a pricing angle worth being direct about. A client paying for a route with unnecessarily scattered pickups is effectively paying for inefficiency built into the route design rather than the actual distance their staff need to travel. An operator who proactively identifies and proposes a clustering redesign, and can show the client the time and cost impact clearly, is having a very different conversation than one who waits for the client to ask why costs feel high.
This works in the operator's favor too. A route redesigned around genuine geographic clusters, matched to correctly sized vehicles, often costs less to run while serving the same passengers just as well, which protects margin on a contract even if the client never asks for a price reduction. Operators who never revisit their own route design are leaving that margin on the table indefinitely, discovered only when a competitor eventually proposes the more efficient version to the same client during a contract renewal.
Turning this into an actual operational habit
None of this requires copying RTA's app or building anything close to their scale. It requires building the habit of periodically reviewing your own pickup data with the same clustering and capacity questions in mind. Where are pickups genuinely scattered when they could reasonably be consolidated. Where is vehicle capacity mismatched with actual headcount on a given route. Where has demand at a specific point grown steadily enough that it deserves a bigger vehicle or an additional trip before it becomes a service complaint.
Answering those questions consistently depends on actually having the underlying data connected somewhere reviewable, rather than scattered across driver group chats and each salesperson's private notes. This is exactly the kind of visibility a platform like TransLogix is meant to provide, tracking every route, every recurring pickup pattern, and every contract's actual headcount trend in one place where it can be reviewed and acted on rather than rediscovered by accident.
The bottom line
A 25% jump in ridership for a demand responsive transport service is not just a public sector success story. It is proof that a large amount of transport demand in Dubai clusters in ways that become genuinely serviceable once you can actually see the pattern clearly. Private operators do not need to compete with RTA to benefit from that lesson. They need to start looking at their own routes with the same question RTA is clearly asking of its own network. Is this vehicle, at this size, going to exactly the right places, or is it running on assumptions nobody has checked in a while.
Sources
- RTA, reported via Gulf News, August 5, 2026, ridership and coverage area figures for Bus On Demand
- RTA and mediaoffice.ae, shared mobility ridership figures across Dubai for the first half of 2026
Want to see how TransLogix handles this for your fleet?